
t 107.5 s
env 0.15
crest±T/2 1.02 minst 0.91
foammodel 0.08 (0% of stage)
foampix 0.0%
#cam=drone&preset=sewers&month=january&controls=0&q=high&speed=0&sim=107.5
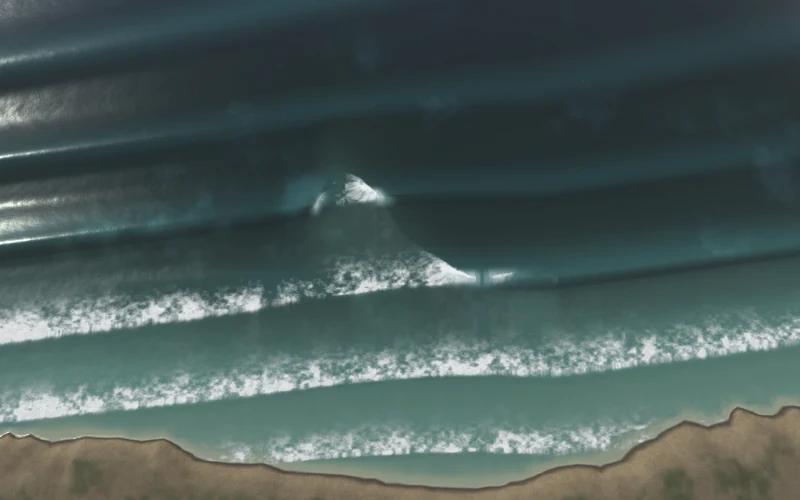
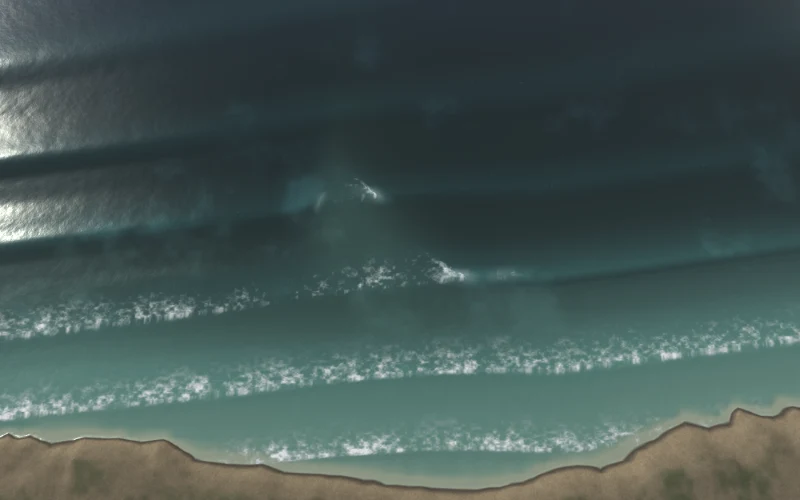
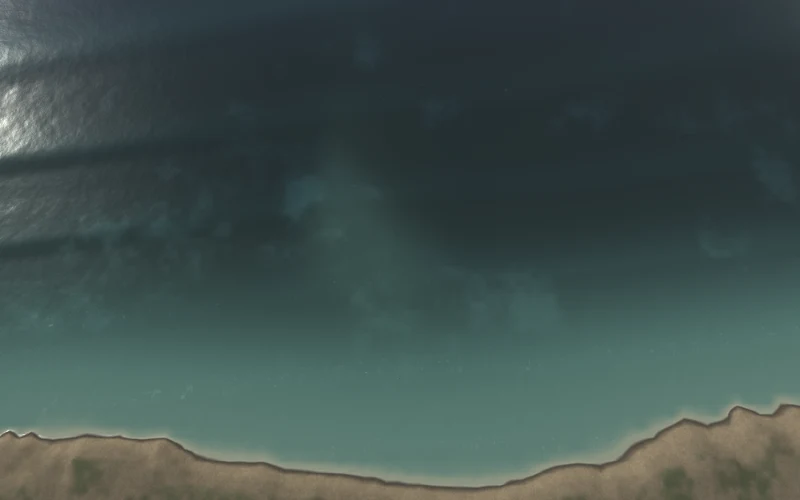
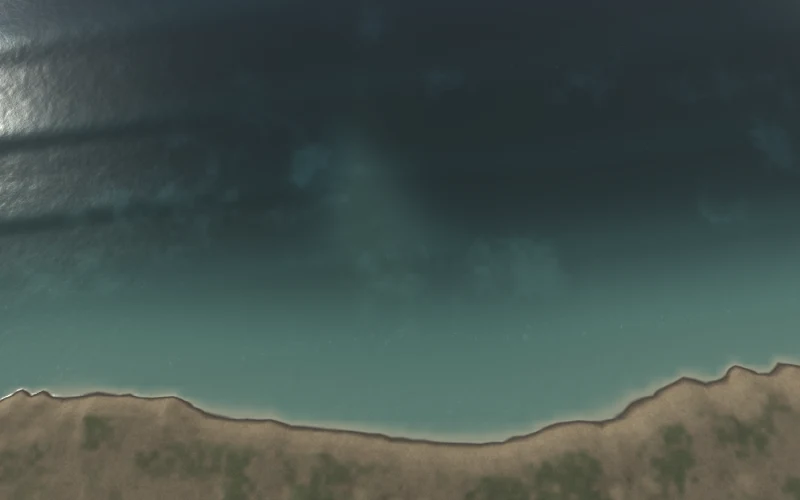
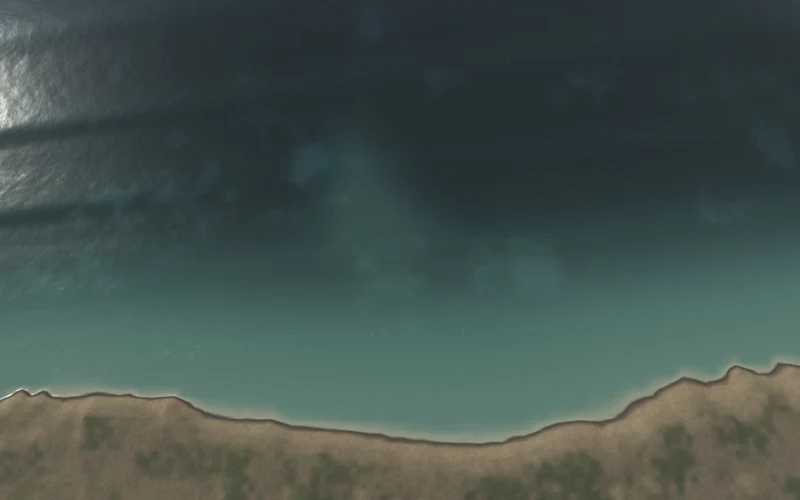
Five clocks across one set beat 1/Δf, phased lull → building → peak → easing → lull.
f3b6bde · f3b6bdedbbbbc2375b144f2ae00f69acafcb44ccmain011a5ba2daf9 — sha256/12 over the files build_site.py ships as sim/../sim/ (published mode)What this is. A QA instrument. Deterministic captures of the pointbreak wave model at clocks pinned by the model itself, laid out so a defect is visible by scanning rather than by hunting. Every cell is labelled with the exact URL hash it was taken at and links into the simulator at that state, so any frame here can be reopened and argued with.
What this is not. Not a validation. The model is unvalidated against measured surf — a first validation pass, model residuals against an independent record of a specific day, is the largest open gap in the project. These sheets check the model against itself: that it is deterministic, that its phases differ, that something breaks where something should. They cannot tell you whether it matches Pleasure Point. Not a surf report, not a forecast, and not usable for any decision about entering the water.
What a still cannot show. No frame here supports a claim with a verb of motion in it. What each cell states is a position at a known clock, read out of the model; the frames are ordered by the model's own clock rather than by inspection, so a reader may compare those positions across a row. The pictures themselves still cannot tell you which way anything is going, and nothing on these pages is measured off them except the pixel foam fraction, which is labelled as such.
Licence. Code, docs and these renders are MIT (© 2026 Andy Edmonds). The frames are Produced
Works under ODbL — the coastline geometry they are drawn over is OpenStreetMap-derived, and the seabed is
NOAA NCEI (public domain). Attribution below is required; share-alike is not triggered by a rendering.
The full file-by-file split is LICENSES.md in the repository.
Coastline & spots: OpenStreetMap contributors, ODbL 1.0 · Bathymetry: NOAA NCEI Monterey Bay 1/3″ coastal DEM, NAVD88 · Seasonality: CDIP MOP v1.1 SC116 hindcast (Scripps).
This is the published view: 7 of 13 rows. The full local sheet runs all seven site presets at
month=january plus two presets across three months. Published here are three sites and two
months. The sites are Sewers (ξ 1.15, the most plunging in the bank), Second Peak (ξ 0.65, the
most spilling) and Privates (the one synthetic-stage site, which is where the n/a readings on this page come from) — the two ends
of the breaker-character range plus the honest edge case. The four omitted sites sit between the two mapped
ones. The months are January and August, the two the CDIP record actually separates: H₀ p75
1.245 m against 0.585 m, with zero hours at or above Hs 1.3 m across twenty-five Augusts. October is the
shoulder month and is in the local sheet to catch a monotonicity break, which is QA rather than exposition.
All five clocks are kept in every row: lull → building → peak → easing → lull is the demonstration.
The location axis: three shipped site presets at the same climatological month, so what differs between rows is the reef. Sewers and Second Peak are the ends of the breaker-character range (ξ 1.15 against 0.65); Privates is the synthetic-stage site.

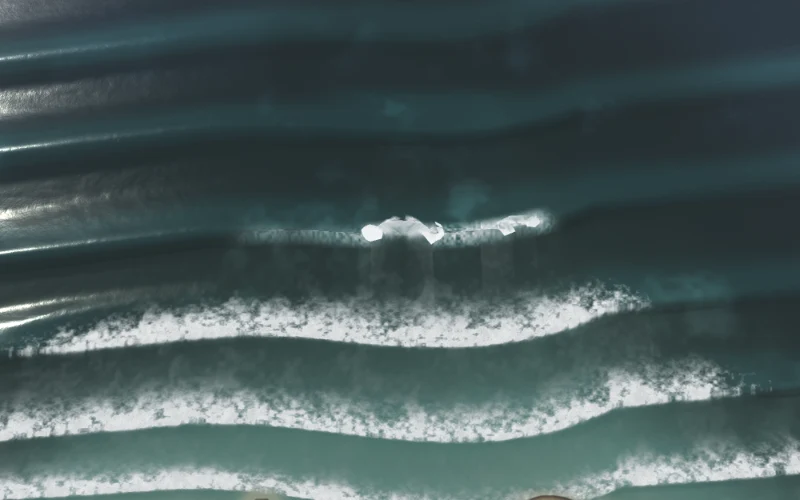
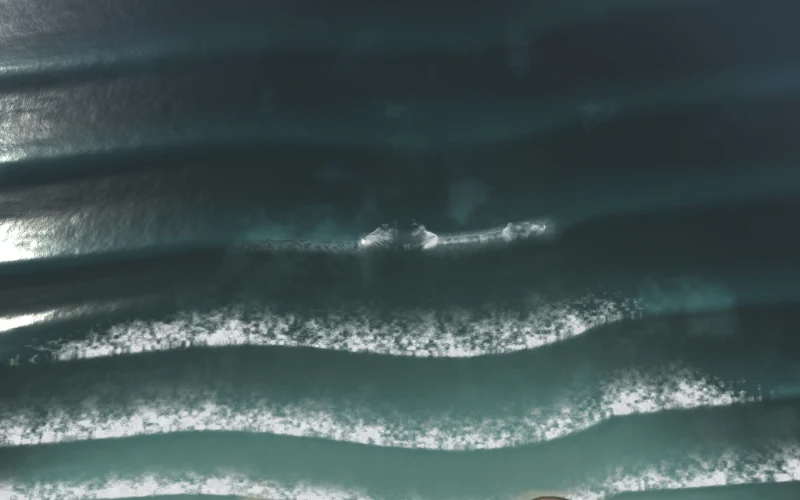

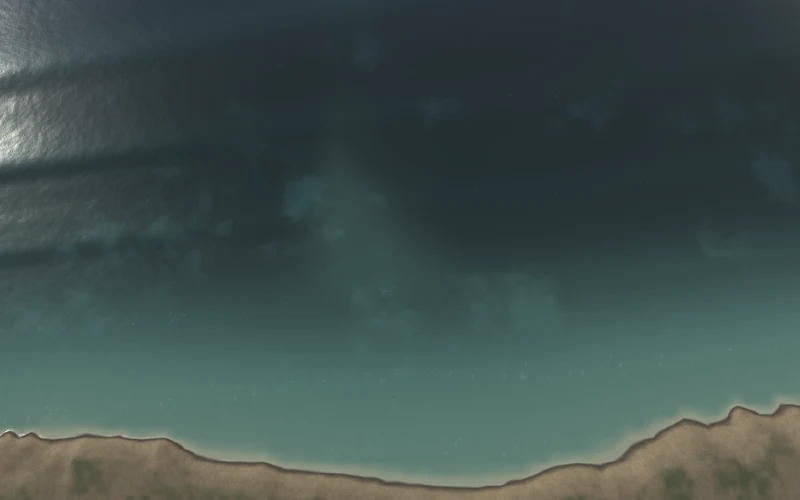
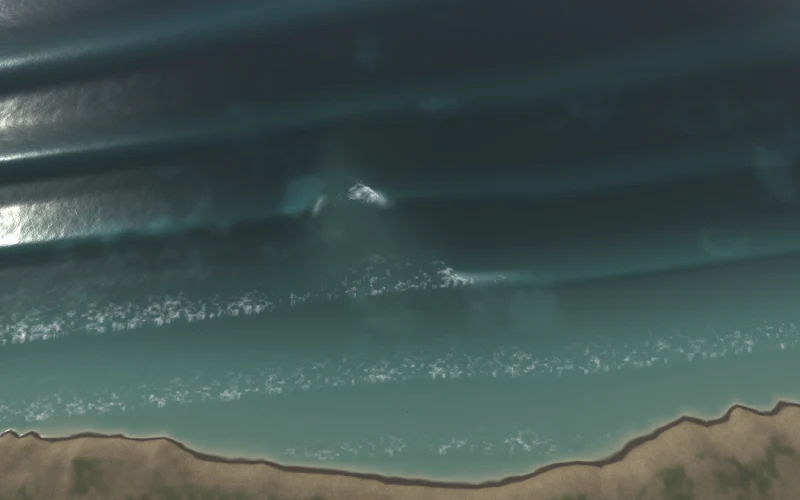
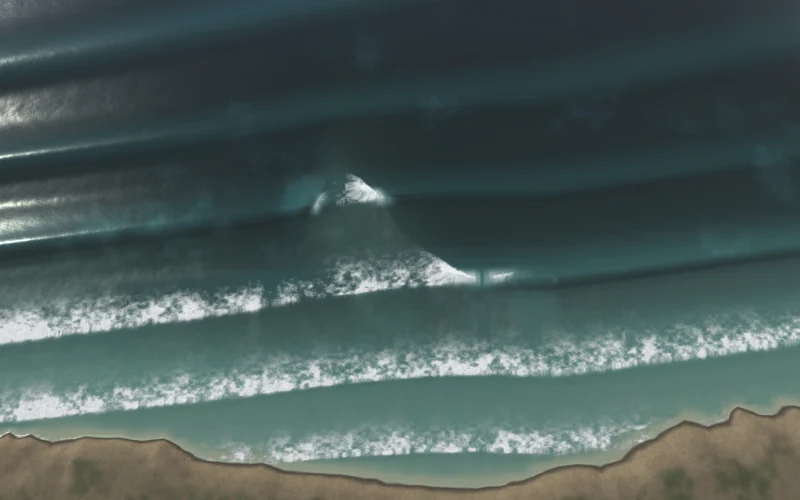
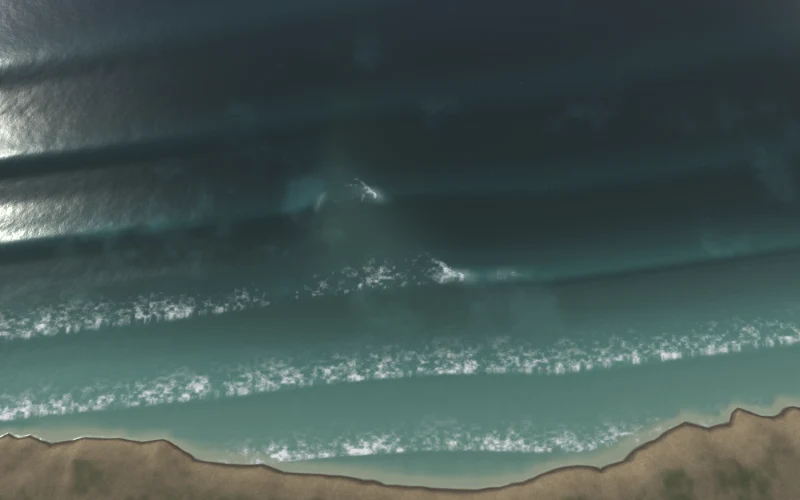
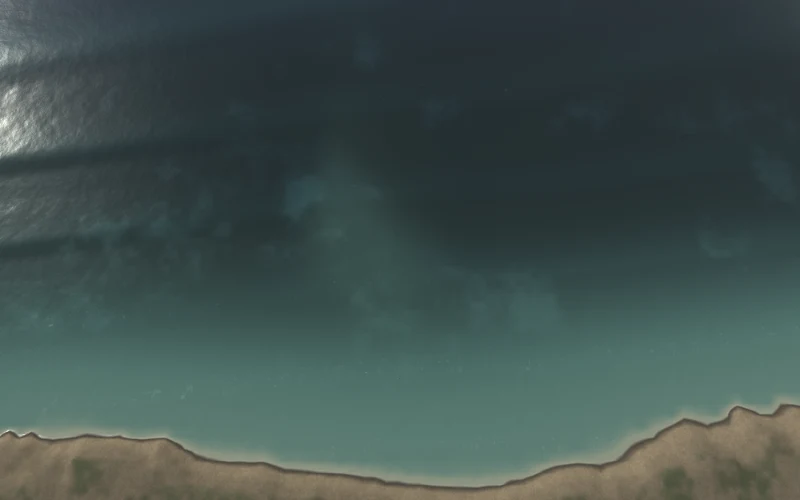

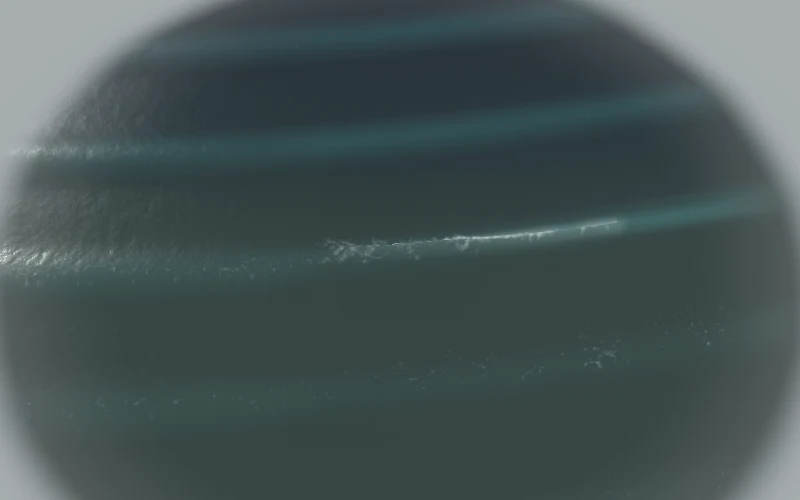
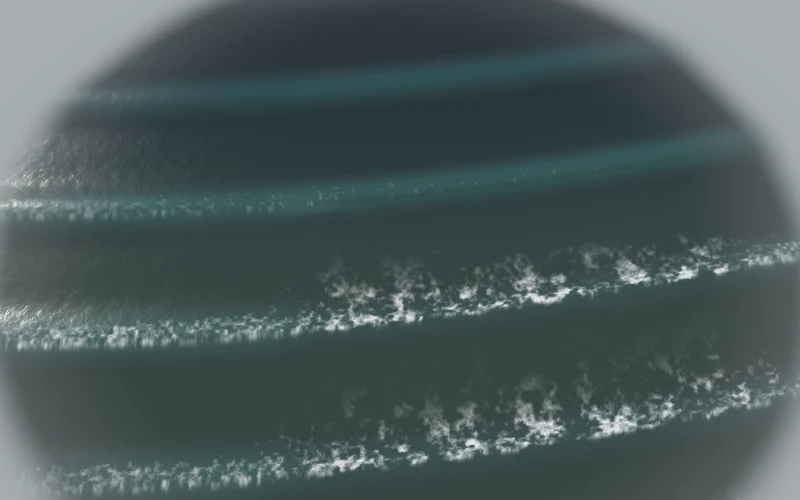
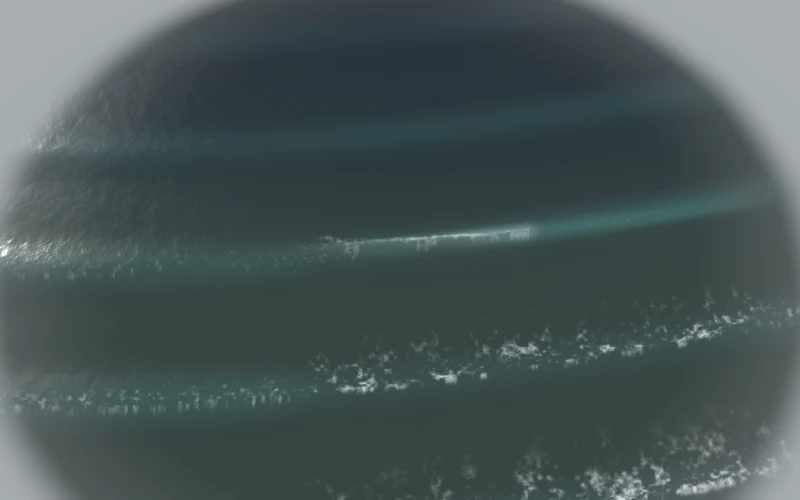

The season axis at its two extremes: January (the peak month, H₀ p75 1.245 m) against August (the flat request, 0.585 m). The shipped peel floor may raise the drawn H₀; Sewers collapses both requests to 1.61 m, while Second Peak draws 1.245 m against 1.08 m. See "What month actually does".


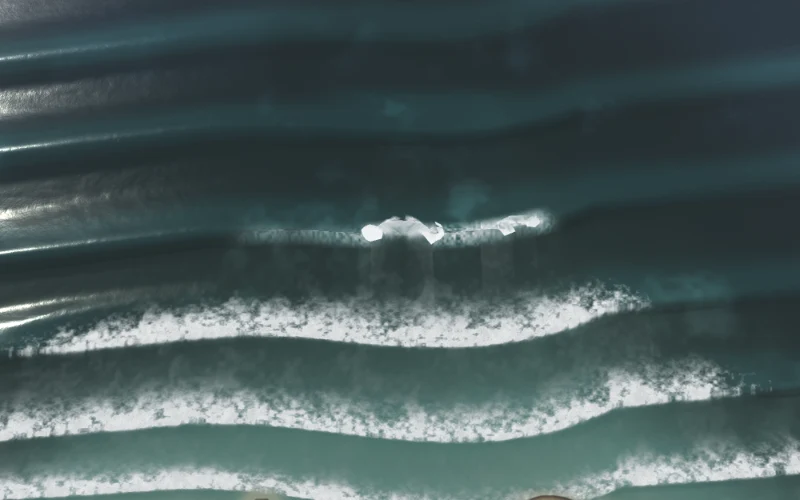
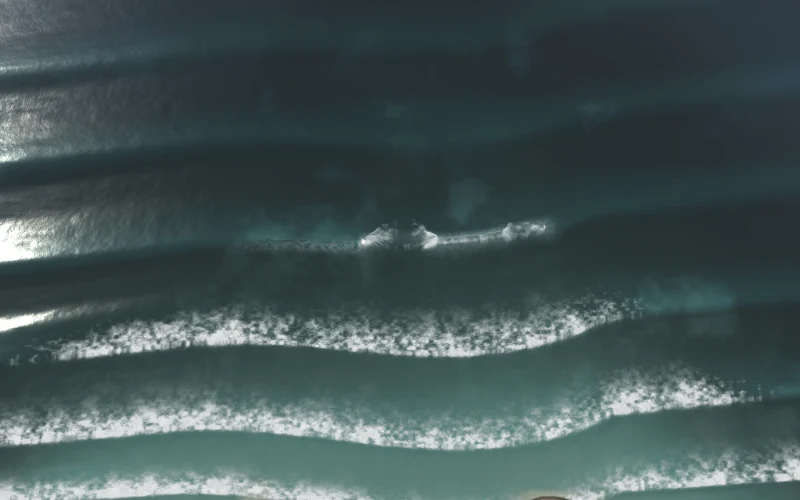



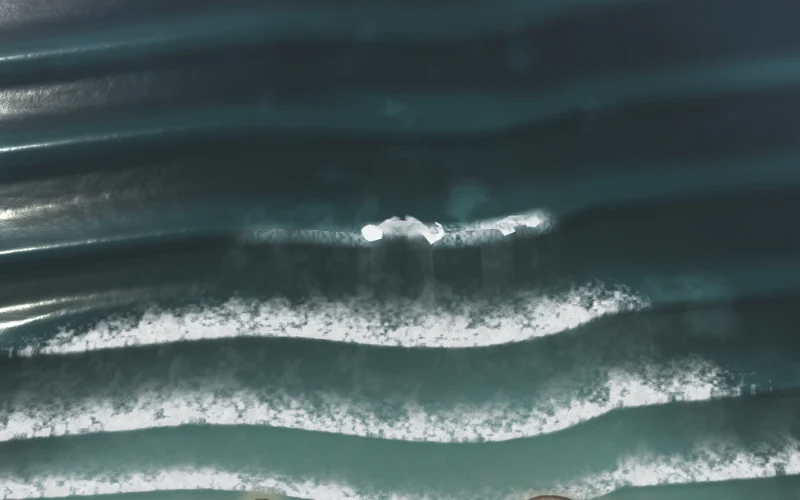
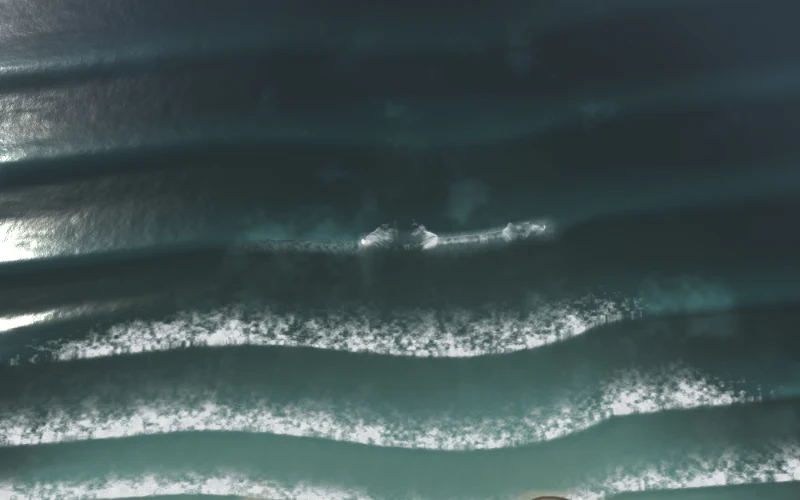

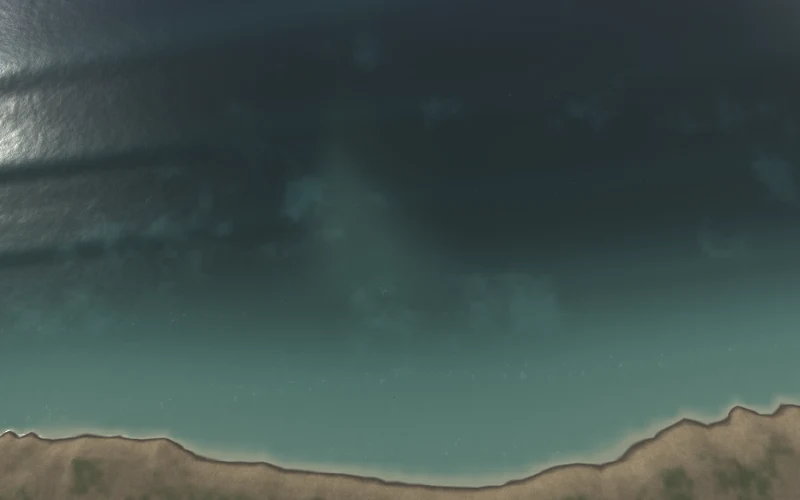
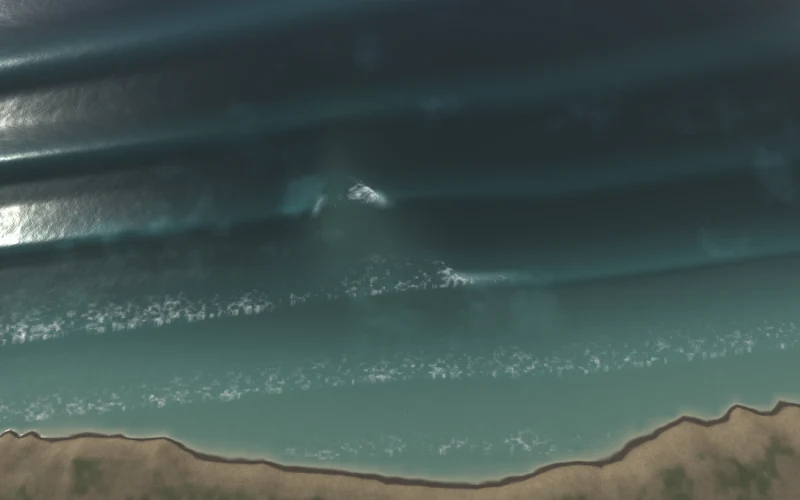
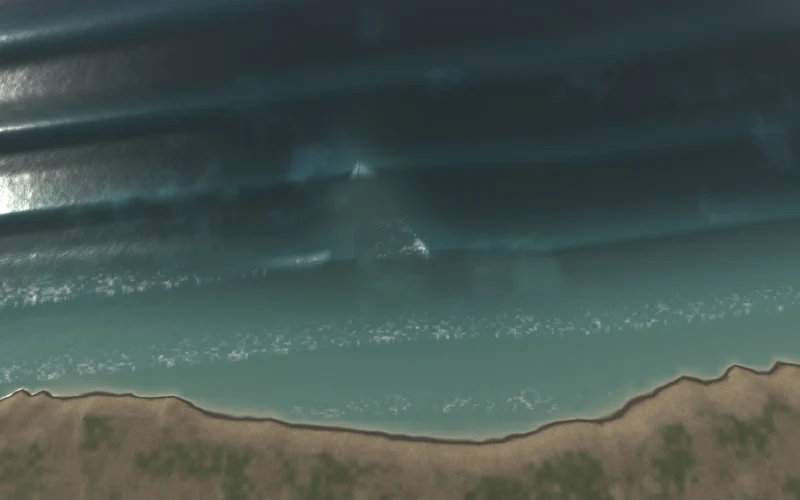
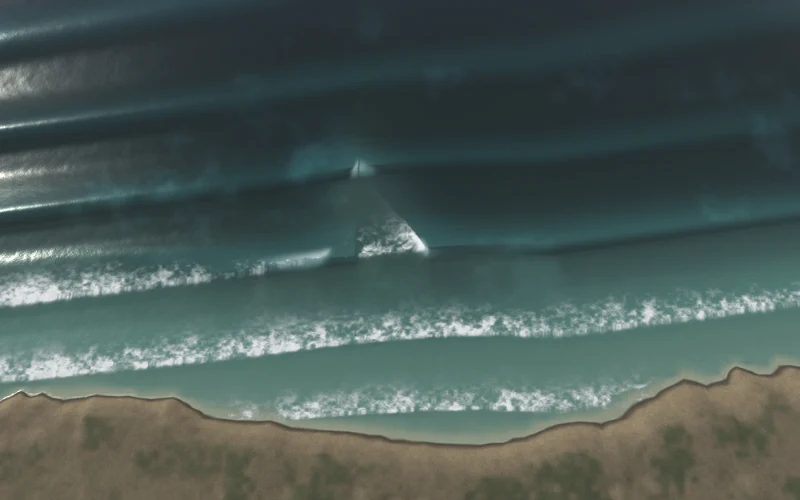
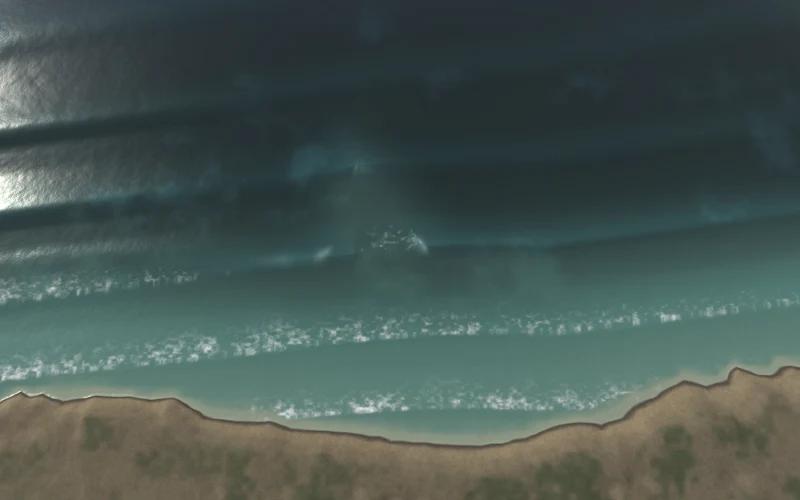
What month= actually does. It sets H₀ to that month's p75 significant wave
height at CDIP SC116 (MOP v1.1, whole years 2000–2024, 218,975 hours used), de-shoaled from the 15 m
contour to the deep-water H₀ the shader re-shoals from. Size only. Period is seasonless in this
data — the interpolated spectral peak is 14.4–15.2 s in every month — so a month restores the site
card's own T, chop and Δf and changes nothing but height. Tide is not a CDIP product and is left alone.
month= and day= are mutually exclusive; an explicit h0= beats both.
August is the flat one for a measured reason: across 2000–2024 there are zero hours at or above
Hs 1.3 m in July or August. See docs/research/PP_CDIP_CLIMATOLOGY.md.
The requested and drawn heights are not always the same. Monthly p75 is routed through the shipped
peel floor before rendering. In this sampled matrix Sewers raises January, October and August to the same
1.61 m drawn H₀; Second Peak keeps January at 1.245 m and raises October/August to 1.08 m. Identical Sewers
season rows are therefore a visible cost of the current model policy, not stale captures. Every row header
prints the drawn state; the requested climatology remains in the row label and permalink. See
docs/MODEL.md §4.6 and the clamp control.
What is on this sheet. The location axis is all seven presets at month=january
(7 rows). The season axis is two presets × three months (6 rows): January the peak month, October the
autumn shoulder, August the flat one. privates is the synthetic-stage site — it has
no measured bed, so its reef is authored rather than surveyed, and the app says so in its readout.
Camera is cam=drone throughout: a set is a property of the whole lineup, and the overhead
view is the one that shows the envelope arriving down the point.
What was left out. 7 presets × 12 months × 5 clocks would be 420 frames. The sampled 7 + 6 = 13 rows cover the location axis completely at one month and the season axis at its two extremes plus a shoulder, on the two sites with the most contrast in ξ (Sewers 1.15, Second Peak 0.65). Not sampled: the other five presets across months; the nine unsampled months; any tide or Δf variation (a month touches neither).
Why the crest number is swept, not sampled (2026-08-19). A set sheet is about the envelope, and this
sheet's columns are one quarter of a set beat apart — 31–42 s — against a carrier wave of 12–15 s. Those two
periods have no relation, so a single-instant crest at one station lands on an arbitrary point of the passing
wave in every column. It looked exactly like a model defect: The Hook read
1.04 / 3.63 / 3.13 / 1.25 / 0.98 m across the beat, a set apparently peaking a column early
and half over by the peak column. Sweeping that same station every 1 s across the beat found waves of
2.11–5.30 m with the biggest arriving at t = 184 s, 3.9 s (0.027 beat) before the peak column's own clock —
the envelope was where it was designed to be and the instrument was reading between two waves. The headline
crest±T/2 is now the max over one carrier period centred on the column clock; the instant
is printed beside it because that is what the frame shows. Nothing in the model moved.
See docs/research/MEASUREMENT_LESSONS.md 12.
Why the lull is not flat. #env floors the set envelope at 0.15 instead of exactly
zero — env = (1−m) + m·cos(…), m = 0.425, so the peak is unchanged at 1.0 by construction and
only the trough rises. That floor is derived from the SC116 spectra two independent ways, not picked.
Columns 1 and 5 are the lull; if they read as dead flat water, that is the regression this sheet is for.
Where this sheet says n/a, and why. Two measures go blank at
Privates, and only at Privates, because that site's coastline defeats the contour fit (16.5 m RMS) and
it runs on a synthetic stage rather than a surveyed seabed. foampix needs a baked break
line to project a corridor onto; with no measured bed there is no baked line, so there is nothing to sample and
the cell reads n/a instead of sampling an arbitrary band of pixels. ceilM, the depth-limited
crest ceiling in the JSON, is null for the same root cause one step further on: the site runs
u_depthMix = 0, the seabed sampler is a 1×1 stand-in, and the depth the shader reads back is the
storage format's quantization floor rather than a seabed — so γh never binds and the "ceiling" would be
1.878·H₀ wearing a depth limit's name. Privates has no measured bed and therefore no ceiling to
be over. An earlier sheet did print that number and produced a headline defect ("2.2× over its ceiling")
that was entirely an artifact of dividing by it. Everything else on the Privates row — crest, foammodel,
the set envelope — is measured the same way as every other site and is directly comparable.
Method caveat. Column 1 of every row is captured from a cold load at its own #sim=; columns 2–5 advance the clock with __pointbreak.setSim() plus two rAF ticks — the mode scripts/capture_temporal.mjs validated against per-frame reloads. Each cell's hash reproduces its frame either way.
Camera drift, recorded not assumed. The #aim cameras frame the baked line's action centroid
and smooth over ~6 s of sim time, so advancing the clock could move the instrument between columns of one row
(MEASUREMENT_LESSONS 11: an instrument that frames itself on the signal is not a fixed instrument). Each row header
carries the largest camera displacement between any two of its five columns. A row with a non-trivial drift there
is comparing slightly different windows, and its numbers should be read accordingly. The camera legitimately
does differ between rows — the break line moves with H₀ — so only within-row drift is a concern.
Stills, not motion. Nothing here is a motion read off the pictures (MEASUREMENT_LESSONS 1). The positions in the cells and the peel in the row headers are model reads at clocks the model itself derived, and the frames are ordered by that clock, so the ordering is established rather than inferred — which is precisely what lesson 1's third failure ("peel direction is rightward, confirmed across two frames") lacked. Read as pictures, these frames still cannot tell you which way the peel runs.
← all QA sheets in this build
· raw measurements (JSON) — the same provenance block, machine-readable
· the essay
· the repo
· commit f3b6bde