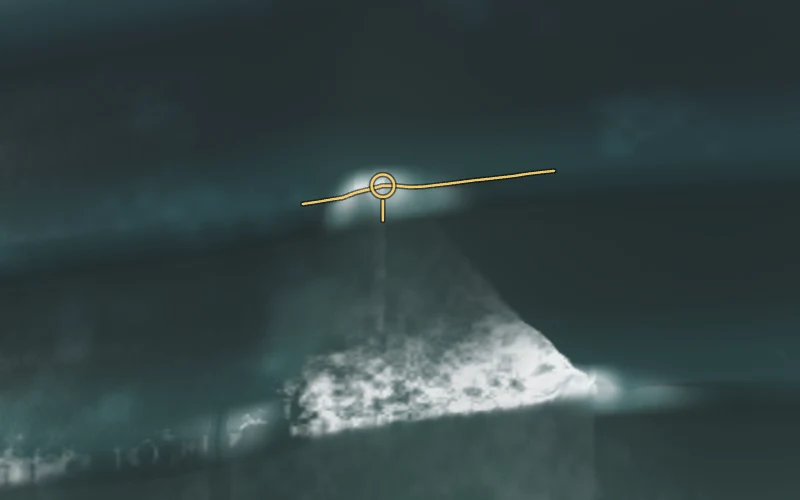
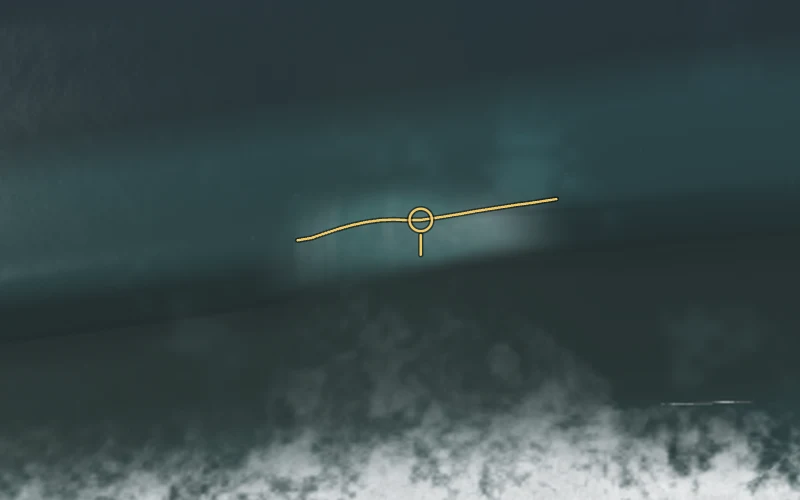
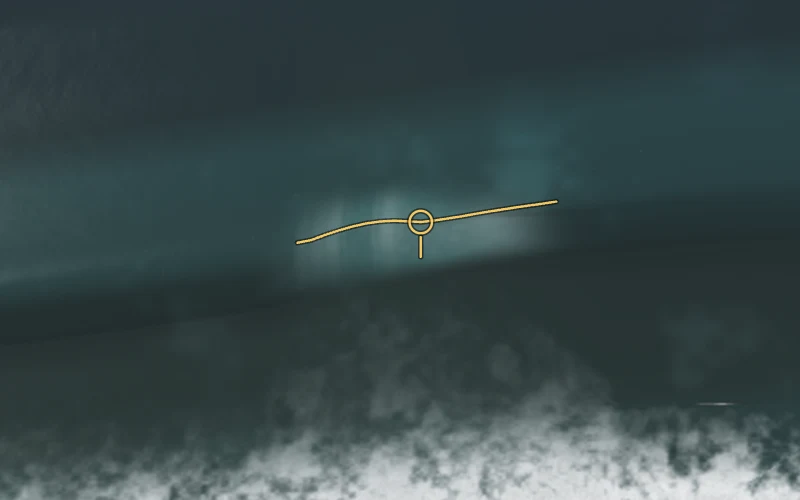
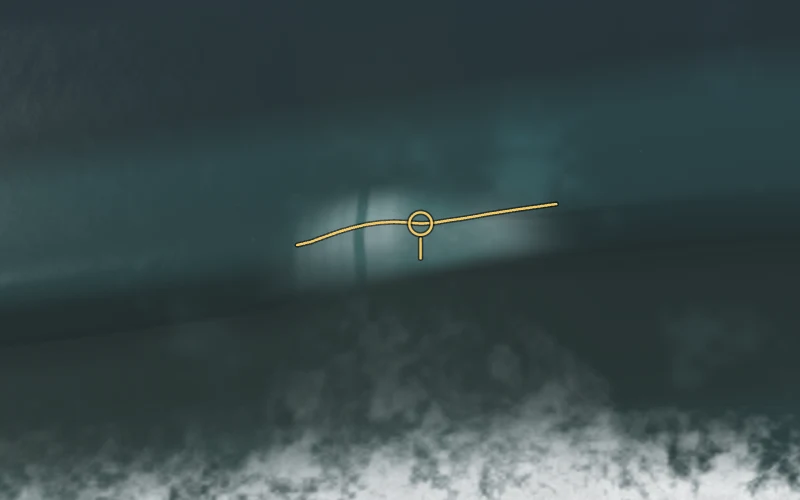
Break progression
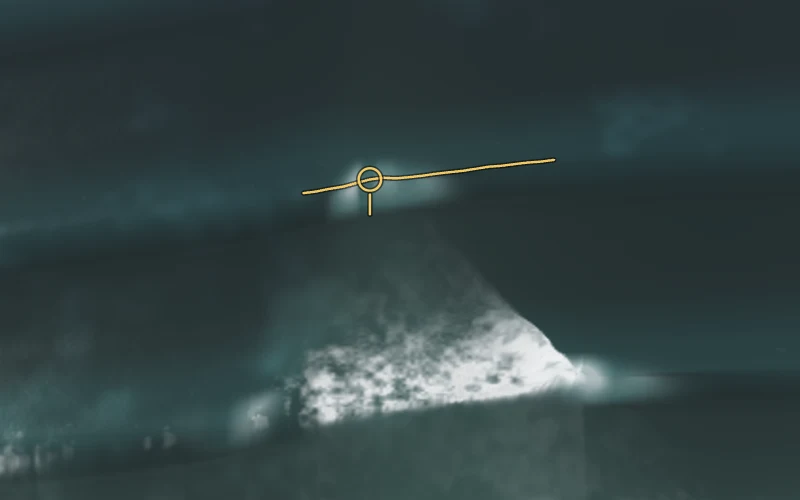
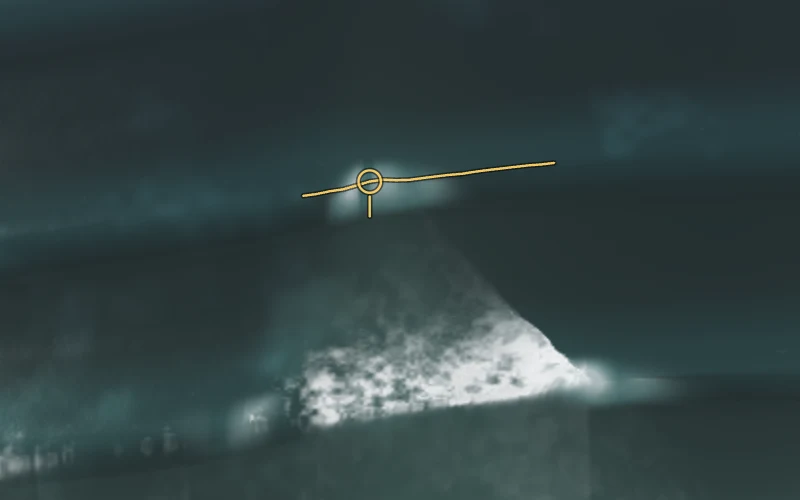
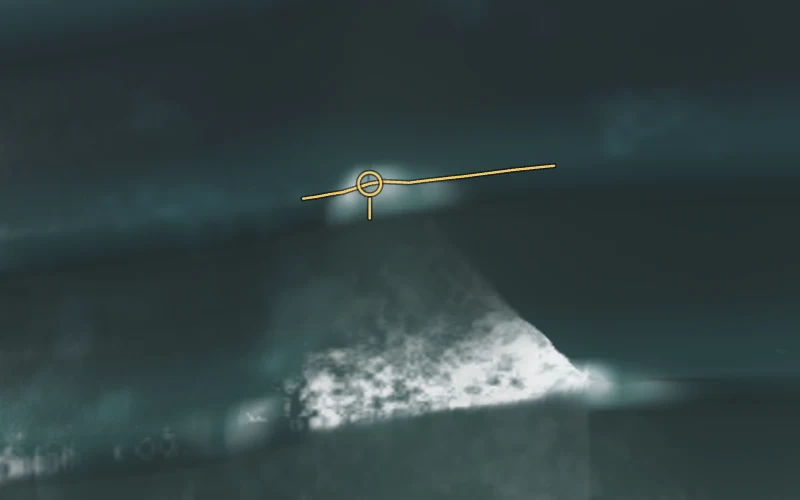
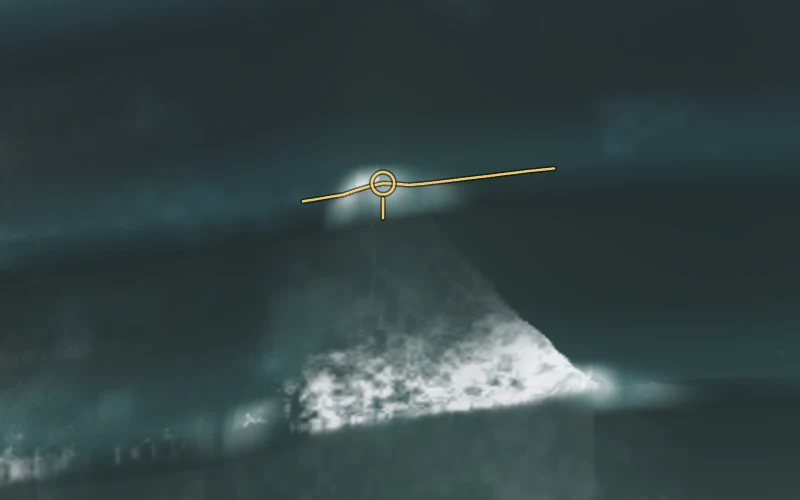
ONE wave through its own break: five clocks from the last at which it is still unbroken to the first at which its crest is whitewater, marked in every frame. The window is that wave's measured break event, not a fixed slice of the period. The two ends of the range that breaks here.
Provenance
- captured
- 2026-08-29T02:21:39.473Z
- built
- 2026-08-29T02:21:39.473Z
- commit
f3b6bde · f3b6bdedbbbbc2375b144f2ae00f69acafcb44cc- branch
main- working tree
- clean
- app build
011a5ba2daf9 — sha256/12 over the files build_site.py ships as sim/- note
- Causal foam lead, accelerating curl crash, derived incident direction, and marine-layer controls.
- links resolve to
../sim/ (published mode)
What this is. A QA instrument. Deterministic captures of the pointbreak wave model at clocks
pinned by the model itself, laid out so a defect is visible by scanning rather than by hunting. Every cell
is labelled with the exact URL hash it was taken at and links into the simulator at that state, so any frame
here can be reopened and argued with.
What this is not. Not a validation. The model is unvalidated against measured surf — a first
validation pass, model residuals against an independent record of a specific day, is the largest open gap in
the project. These sheets check the model against itself: that it is deterministic, that its phases
differ, that something breaks where something should. They cannot tell you whether it matches Pleasure Point.
Not a surf report, not a forecast, and not usable for any decision about entering the water.
What a still cannot show. No frame here supports a claim with a verb of motion in it. What each cell
states is a position at a known clock, read out of the model; the frames are ordered by the model's own
clock rather than by inspection, so a reader may compare those positions across a row. The pictures themselves
still cannot tell you which way anything is going, and nothing on these pages is measured off them except the
pixel foam fraction, which is labelled as such.
Licence. Code, docs and these renders are MIT (© 2026 Andy Edmonds). The frames are Produced
Works under ODbL — the coastline geometry they are drawn over is OpenStreetMap-derived, and the seabed is
NOAA NCEI (public domain). Attribution below is required; share-alike is not triggered by a rendering.
The full file-by-file split is LICENSES.md in the repository.
Coastline & spots: OpenStreetMap contributors, ODbL 1.0 ·
Bathymetry: NOAA NCEI Monterey Bay 1/3″ coastal DEM, NAVD88 ·
Seasonality: CDIP MOP v1.1 SC116 hindcast (Scripps).
This is the published view: 2 of 6 rows. The full local sheet runs six wave sizes — four condition
bundles (day=small, modelcard, overhead, big) and two
h0=-only rows that hold period and tide fixed. Published here are the two ends of the range that
breaks at this site: the model-card day (H₀ 1.50 m, T 14 s) against the big groundswell (H₀ 2.50 m, T 17 s).
The h0= rows separate height from period, which is a QA question rather than a reader's, and
day=overhead sits between the two kept rows.
Why the small end is not the smallest day. day=small is H₀ 0.70 m, and Second Peak's
measured peel floor is 1.08 m — below it the baked break line abandons the oblique reef branch and the
peel collapses (stage α 6.6° against a 41° target). Measured on the same instrument as every other row,
whitewater at the tracked crest there peaks at 0.193, against 0.858–0.890 for every row that
breaks. It is not a small break; it is not a break. Publishing it under a header that says
breaking — whitewater at the crest would be the exact failure this page exists to avoid, so it stays on
the local sheet, labelled, with its own numbers on it.
All five clocks are kept in every row: this sheet is a progression, and a progression sampled at three
points stops being one.
Why only the drone camera. The local sheet shows the same rows and the same derived clocks from the
cliff stand as well, and that view is the better one in principle — throw, curtain and collapse are all edge-on
from a low profile. In practice the break at Second Peak is several hundred metres off that stand, so the
tracked crest lands within about 20 px of the horizon and the whitewater burst this page measures at 0.86 is a
few pixels of grey. The crop is bounded at 2.4× before upsampling turns soft, so it cannot rescue the frame;
reaching further needs capture at a higher device scale factor, which moves the pixel-corridor coordinates the
foam measurement depends on. That is deliberate work rather than a side effect, so the cliff rows stay on the
local sheet until it is done.
Drone camera — overhead
Same six rows, same derived clocks, from above: this is where the along-crest peel (the zipper) reads instead. Tilted 15° off nadir since 2026-08-22 — it stood at 6.25°, near enough to straight down that a crest had no silhouette and the shot could only show the plan of the break, never its form.
row ↓ / clock →
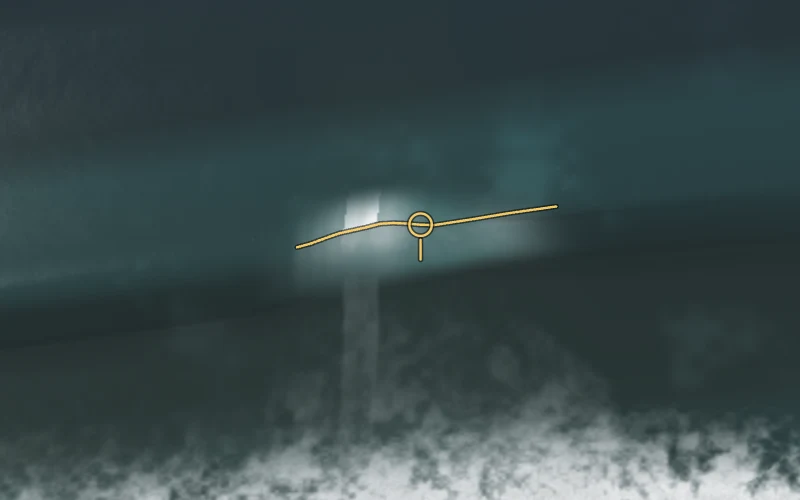
1. still unbroken0% of the event · crest 0.00 Λ on
2. a quarter into the break25% of the event · crest 0.01 Λ on
3. halfway through the break50% of the event · crest 0.02 Λ on
4. three quarters through75% of the event · crest 0.04 Λ on
5. breaking — whitewater at the crest100% of the event · crest 0.05 Λ on
model-card day
bundle · day=modelcard
- H₀
- 1.50 m
- T
- 14.0 s
- tide
- 0.00 m
- Δf
- 0.006 Hz
- ξ
- 0.65
- step
- 0.17 s
- row spans
- 0.70 s
- peel
- +4 m
- ring off line
- ≤ 2.70 m
- cam drift
- 0.00 m
foam on the crest
0.01 → 0.01 → 0.25 → 0.54 → 0.79
OSM/NCEI Second Peak · u 668 m · reef -1.30 m NAVD88 · breaker anatomy · bed measured+reef · model-card day
Cropped to 420×263 of the 1000×625
capture (2.38× closer), the same window in all five columns. Camera untouched — that is what the
cam drift above still measures.
#preset=secondpeak&cam=drone&day=modelcard&controls=0&q=high&speed=0
big clean groundswell
bundle · day=big
- H₀
- 2.50 m
- T
- 17.0 s
- tide
- -0.20 m
- Δf
- 0.004 Hz
- ξ
- 0.65
- step
- 0.11 s
- row spans
- 0.42 s
- peel
- +0 m
- ring off line
- ≤ 6.11 m
- cam drift
- 0.00 m
foam on the crest
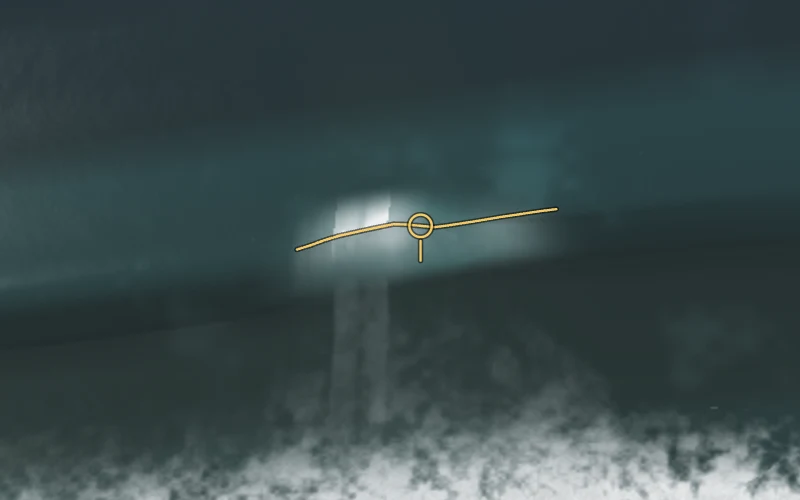
0.02 → 0.03 → 0.17 → 0.71 → 0.85
OSM/NCEI Second Peak · u 668 m · reef -1.30 m NAVD88 · breaker anatomy · bed measured+reef · big clean groundswell
Cropped to 420×263 of the 1000×625
capture (2.38× closer), the same window in all five columns. Camera untouched — that is what the
cam drift above still measures.
#preset=secondpeak&cam=drone&day=big&controls=0&q=high&speed=0